 Faculty of Science, Technology and Medicine
 Faculty of Law, Economics and Finance
 Faculty of Humanities, Education and Social Sciences
 Interdisciplinary Centre for Security, Reliability and Trust
 Luxembourg Centre for Systems Biomedicine
 Luxembourg Centre for Contemporary and Digital History
 Luxembourg Centre for European Law
 Luxembourg Centre for Socio-Environmental Systems
Greenhouse Gas Emission Report (2023)
Overall increase in emissions…
The University of Luxembourg has updated its greenhouse gas (GHG) emissions analysis for the year 2023, following the first comprehensive assessment conducted for the reference year 2019. The analysis estimates total emissions at 44 617 tCO₂e, with an associated uncertainty of ±14,9% (±6 642 tCO₂e). This uncertainty reflects the varying reliability and precision of the datasets and methodologies used across the different emission categories, particularly for Scope 3 emissions (other indirect emissions) such as procurement, mobility and capital items.
Since 2019 and the most recent analysis, the University has continued to grow in terms of staff, students, research projects and infrastructure. Despite adverse and significant external events (the COVID-19 pandemic, the energy crisis linked to the war in Ukraine…) and internal shifting practices (expansion of homeworking…), the greenhouse gas emissions resulting from the University’s activities have increased by 3,7% compared to the revised 2019 reference emissions (44 617 tCO₂e in 2023 vs 43 030 tCO₂e in 2019).
The largest source of emissions was the purchase of goods and services (42%), followed by mobility (31%), capital items (18%) and energy consumption (9,5%).
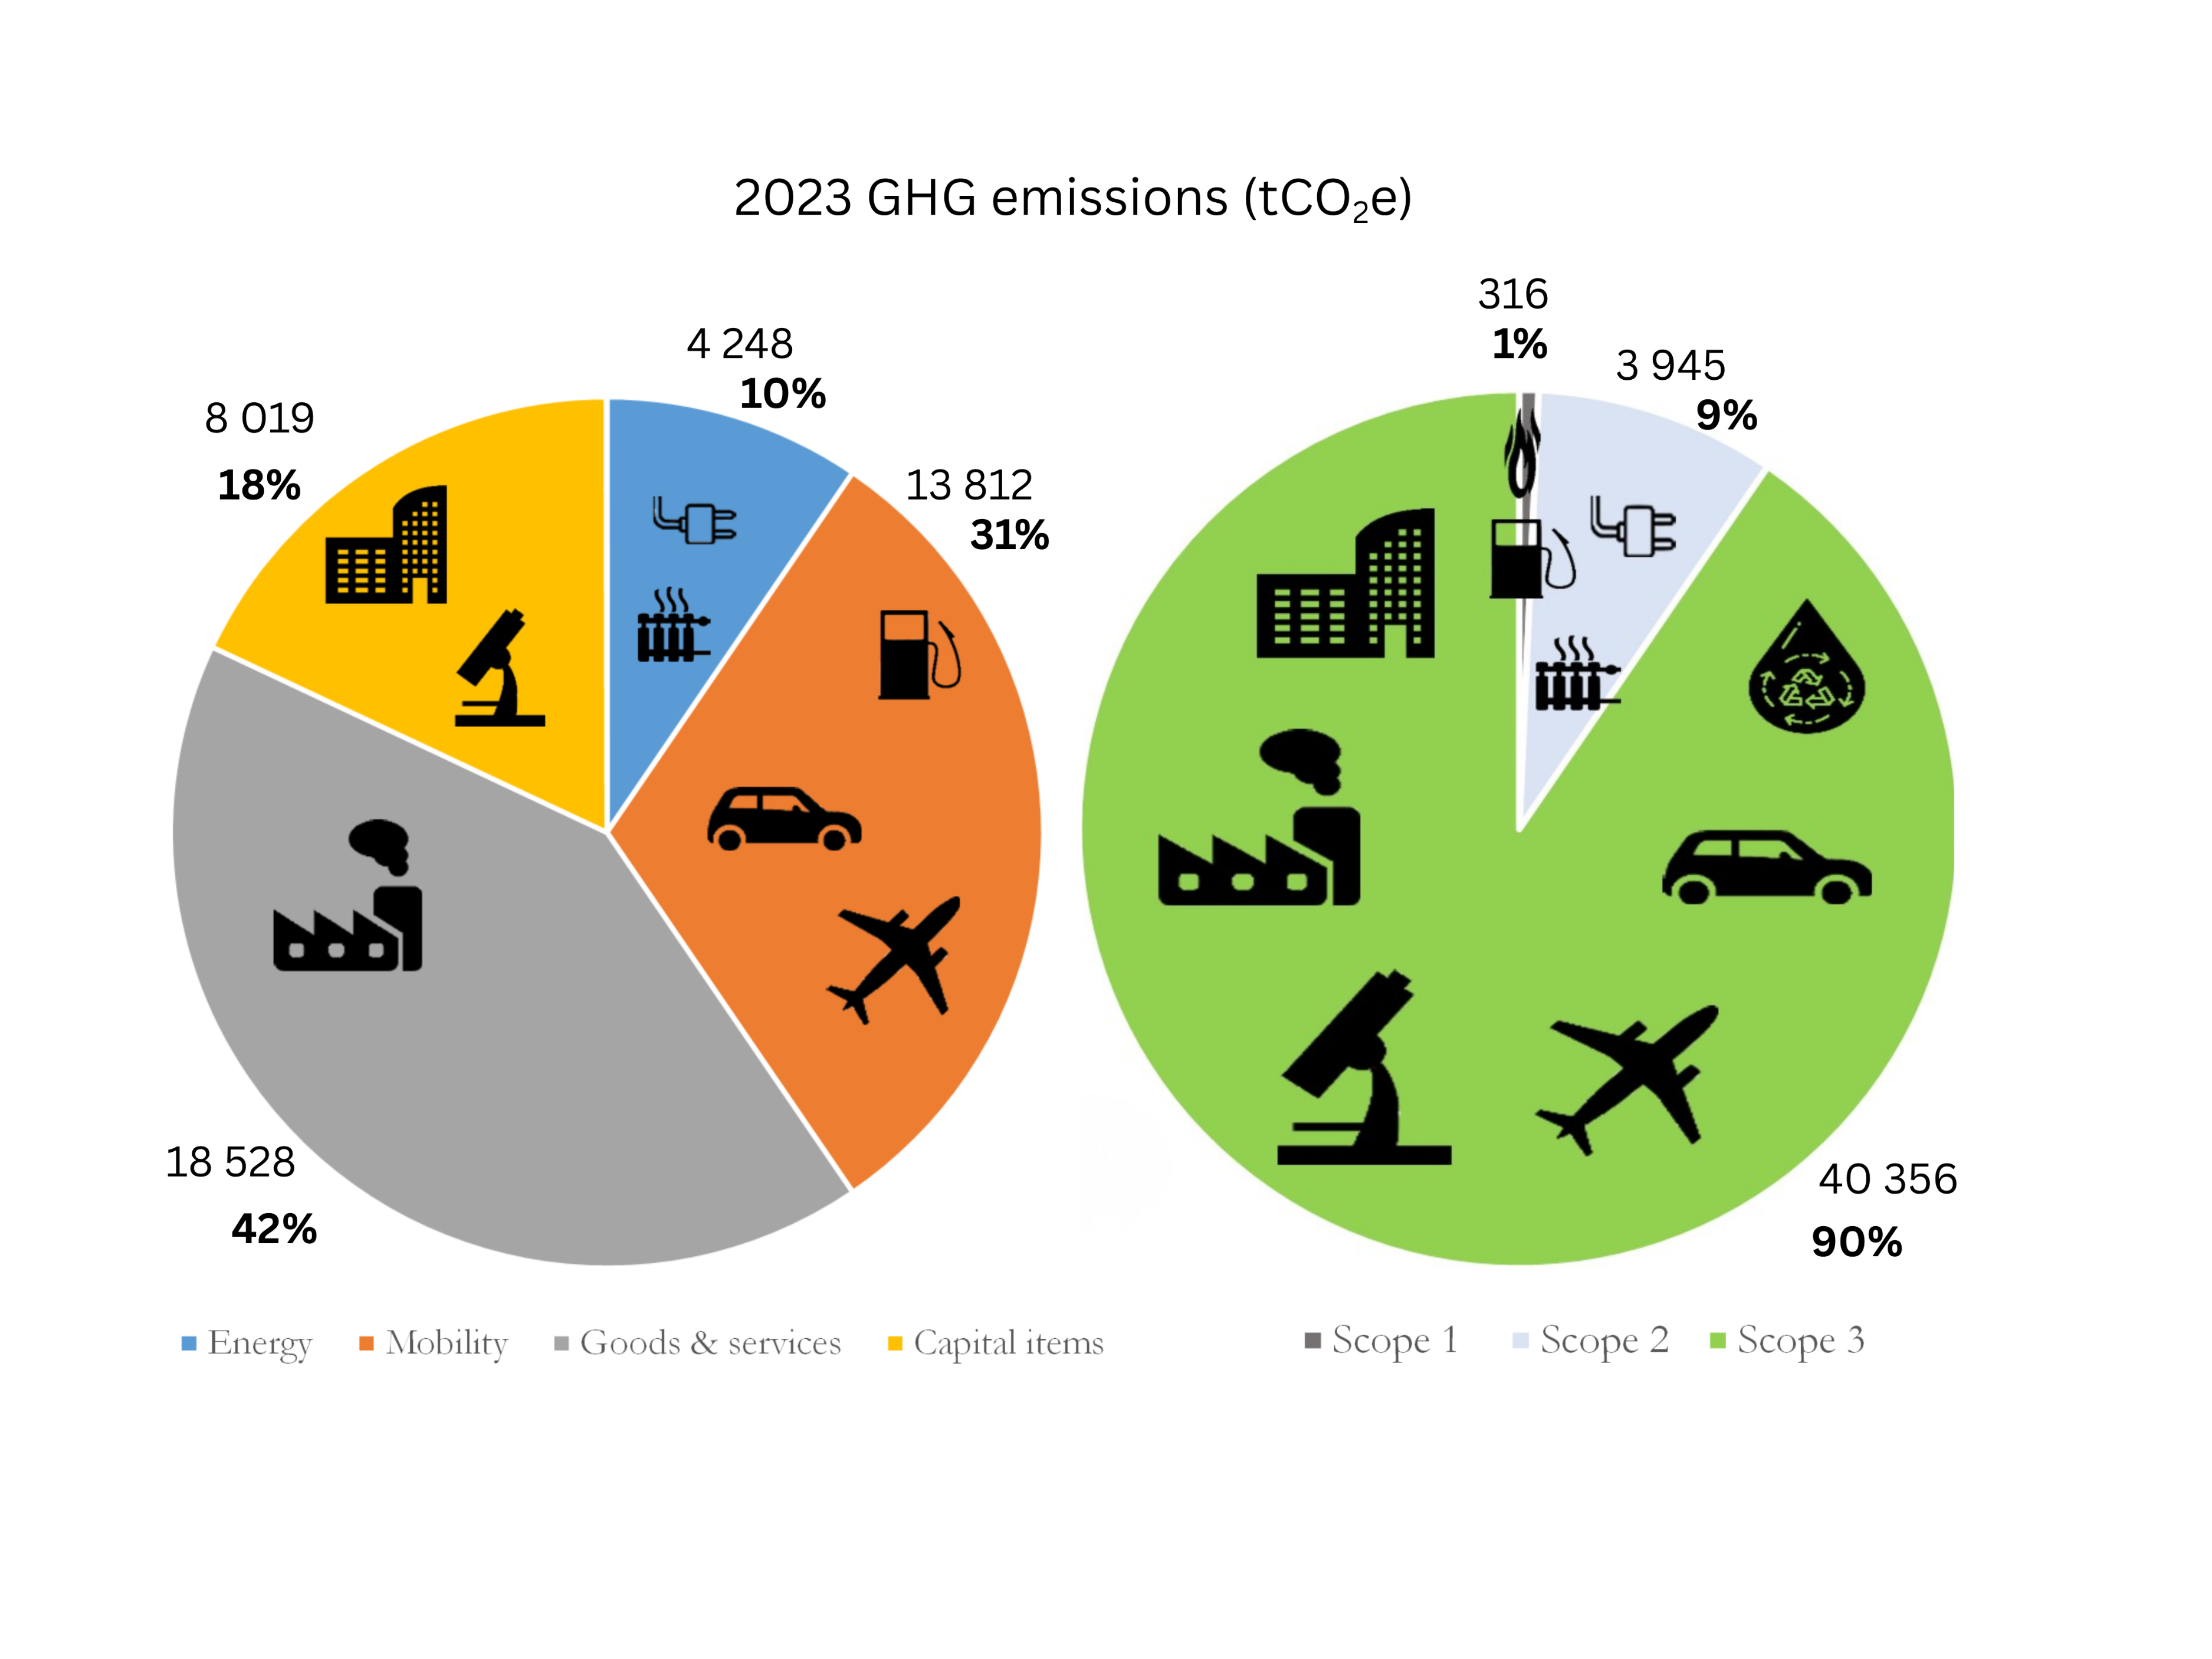
Figure 1: 2023 GHG emissions by category and by scope
Most emissions (90%) fall under Scope 3, meaning indirect emissions linked to activities such as procurement, commuting, business travel and investments. Direct on-site (scope 1) emissions represented only 1% of total emissions, while indirect emissions from consumption of purchased energy, such as electricity, heat, and cold (scope 2) represent 9% of the total emissions in 2023.
… but targeted reductions
While emissions from the purchase of goods and services and from capital items increased, those from energy consumption and mobility (commuting and business travel) decreased.
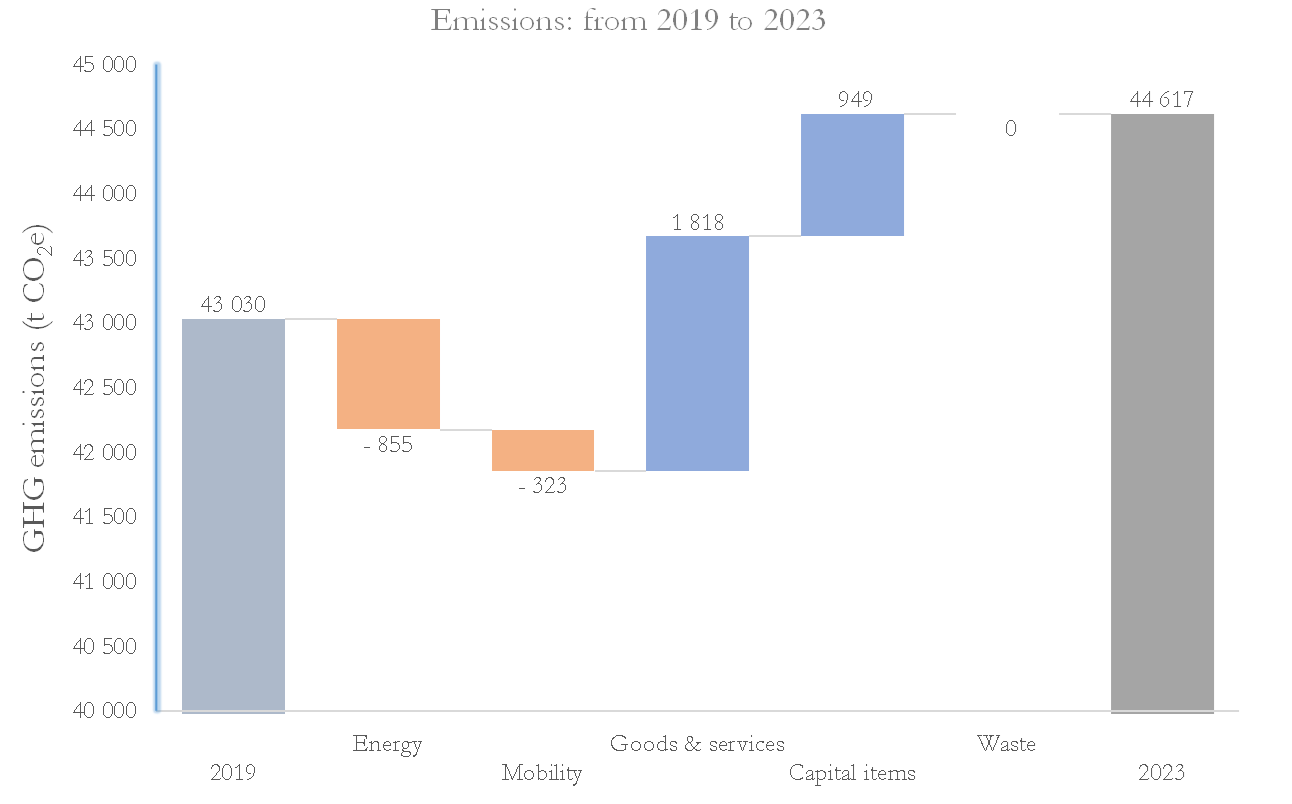
Figure 2: Change in emissions between 2019 and 2023
A decreasing carbon footprint
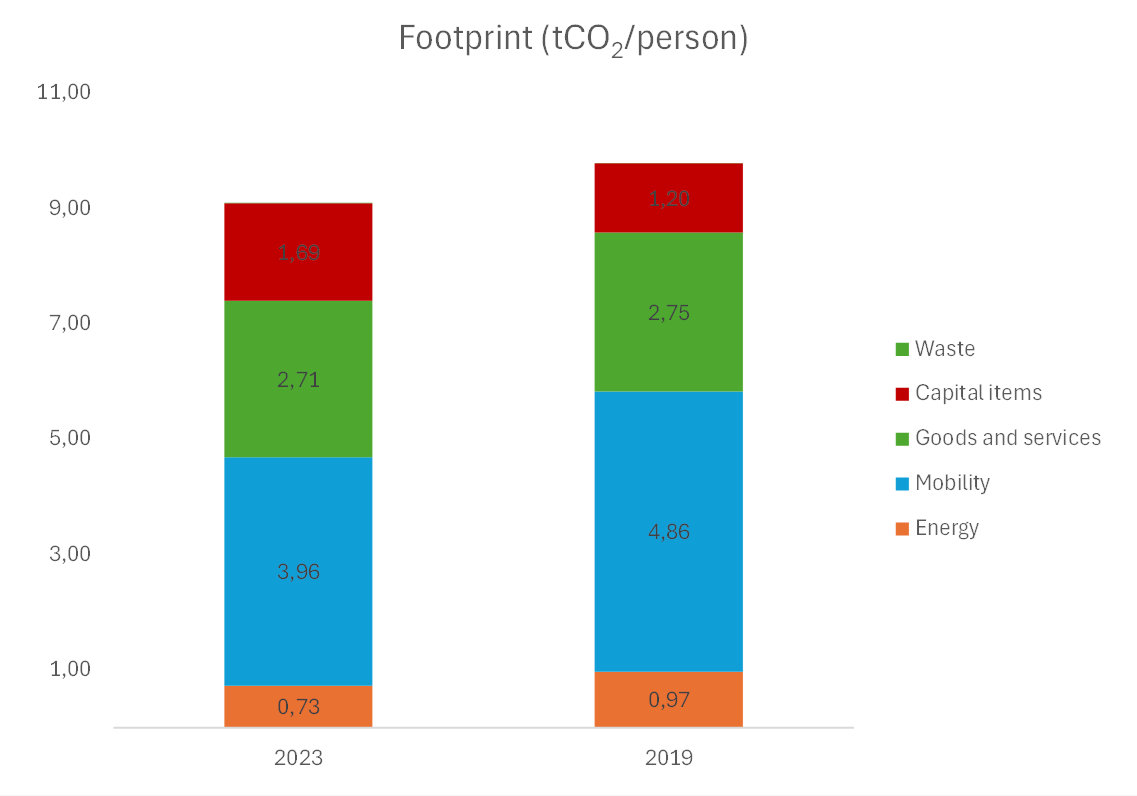
Figure 3: University’s carbon footprint in 2023 and 2019
Although total emissions increased slightly in absolute value, the University’s carbon footprint (University’s emissions per staff member and student) decreased from 9,78 tCO₂e/person in 2019 to 9,09 tCO₂e/person in 2023 (-7,1%).
This suggests a relative decoupling between the growth in the University in terms of personnel, activities and infrastructures, and the greenhouse gas emissions resulting from its activities. These are less carbon-intensive and may represent a step towards an absolute decrease in emissions in the future.
Looking ahead
The report confirms that targeted sustainability measures can generate measurable reductions in emissions, particularly in energy consumption and mobility. At the same time, the continued expansion of the University’s research activities, infrastructure and digital capacities continues to exert upward pressure on overall emissions.
The analysis underlines the importance of continuing efforts in:
- Sustainable procurement, by developing a relevant methodology and influencing suppliers through the tendering process to offer greener products and services
- Energy efficiency, especially when the redevelopment of Kirchberg campus takes place, and the University embarks on an even more extensive digital transformation, incorporating AI and quantum computing.
- Low-carbon mobility, based on the newly released sustainable travel policy, the participation in the redesign of the Belval mobility plan and a focus on limiting the impacts of the inter-campus trips
- Responsible infrastructure development, focused on decoupling the University’s growth in activities and the need for additional space and equipment, through innovative solutions like sharing, pooling and extending usage of space and equipment.
- And increasing the understanding of waste generated by the University’s activities to design reduction solutions and proper management actions.
Purchase of goods and services remains the largest source of emissions.
Emissions linked to the purchase of goods and services reached 18 523 tCO₂e in 2023, representing 42% of total emissions and an increase of 10,9% compared to 2019.
Consumables, repairs and maintenance, low-value equipment and professional services were identified as the largest contributors within this category.
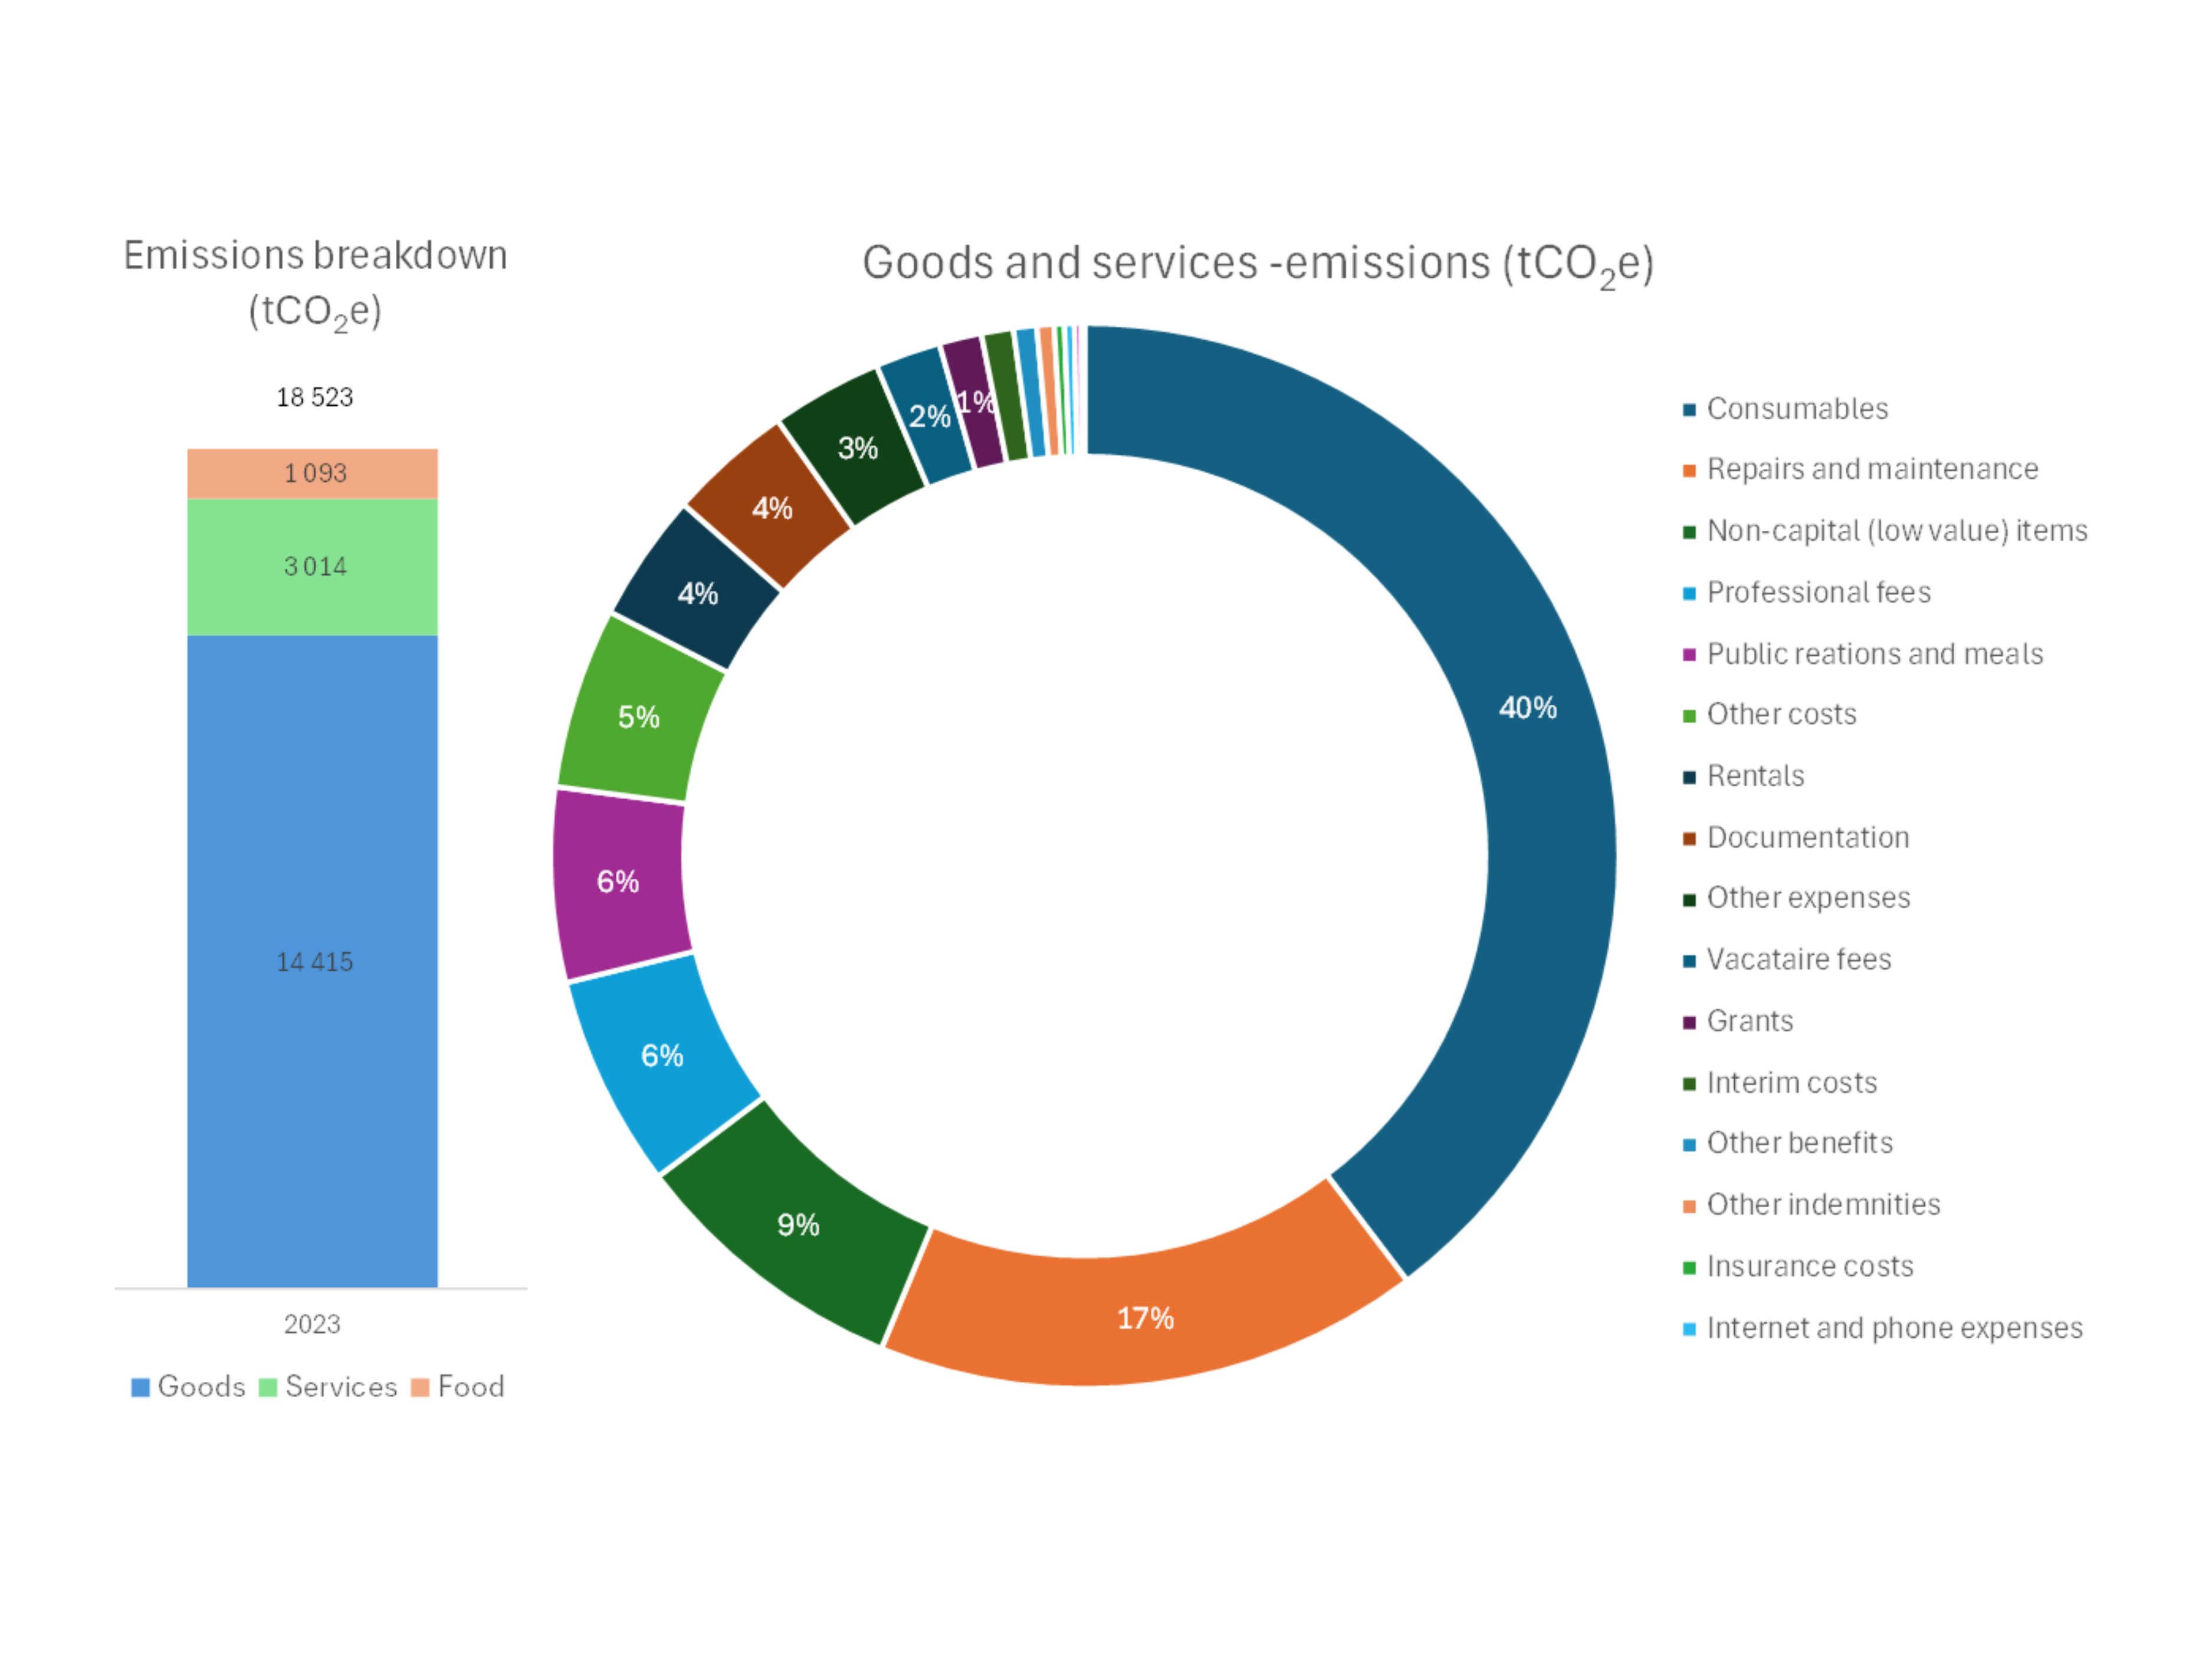
Figure 4: Emissions (purchases of goods and services) in 2023, by category (left) and type (right)
The report highlights that consumables generate disproportionately high emissions due to their chemical and plastic components. It also underlines the limits of monetary-based accounting methods that are used to compute these emissions. The results are strongly influenced by inflation, which was reported as extremely high during the 2019-2023 period, and do not capture the importance of sustainable procurement practices present at the University and therefore their potential in reducing procurement emissions.
Mobility, the 2nd-largest source of emissions, is slightly down.
Mobility-related emissions (12 612 tCO₂e in 2023) represented 31% of total emissions in 2023 and decreased by 2,3% compared to 2019.
Commuting between home and campus remained the largest mobility-related source of emissions. In 2023, members of the University community travelled more than 72 million kilometres to work and study.
While public transport represented the majority of travelled distance, private cars remained responsible for most commuting emissions.
Commuting drove the reduction of emissions in mobility. The report highlights the positive impact of:
- The implementation of a homeworking policy,
- The support to public transport use,
- The increased focus on car-sharing and car-pooling,
- The promotion of active mobility,
- And the progressive shift toward electric mobility in daily travel.
Homeworking alone contributed to a reduction of approximately 328 tCO₂e in staff commuting emissions.
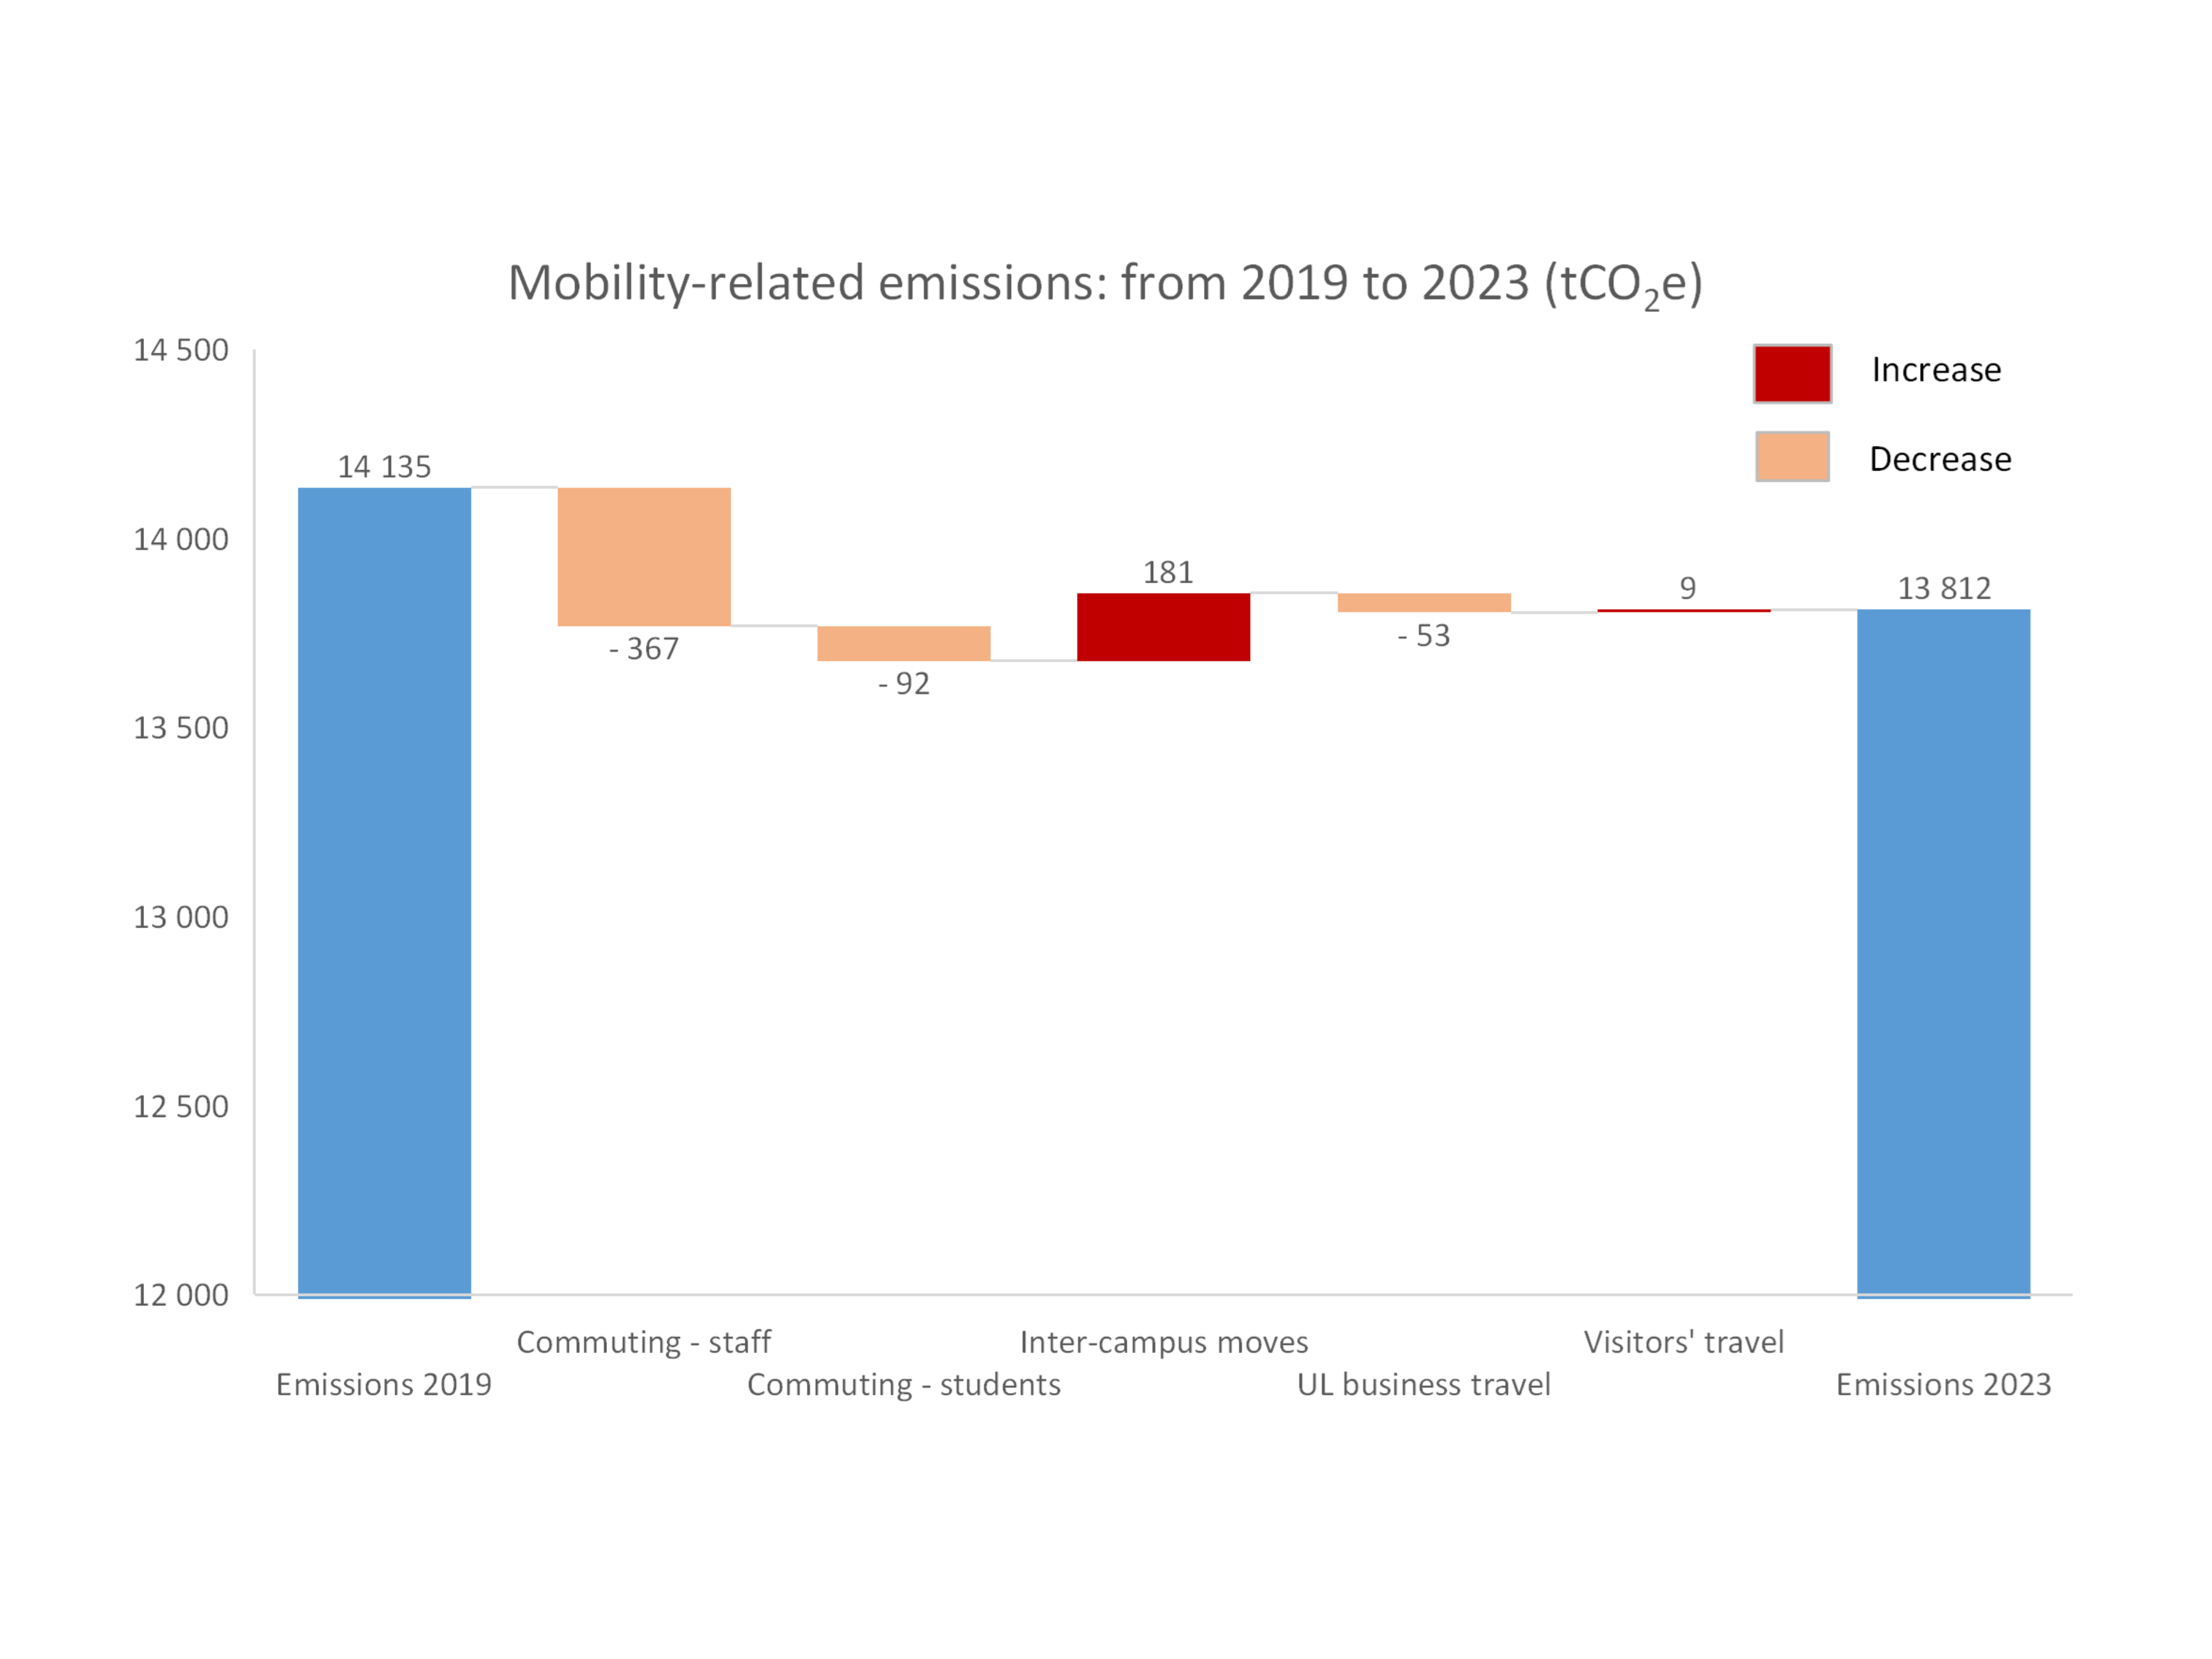
Figure 5: Change in mobility-related emissions between 2019 and 2023
As for business travel by University members and visitors, emissions remain quite stable vs. 2019. Distances travelled in 2023 are still well below the 2019 reference, but emissions were negatively impacted by inflation observed on accommodation and modes of transport assessed by the monetary approach.
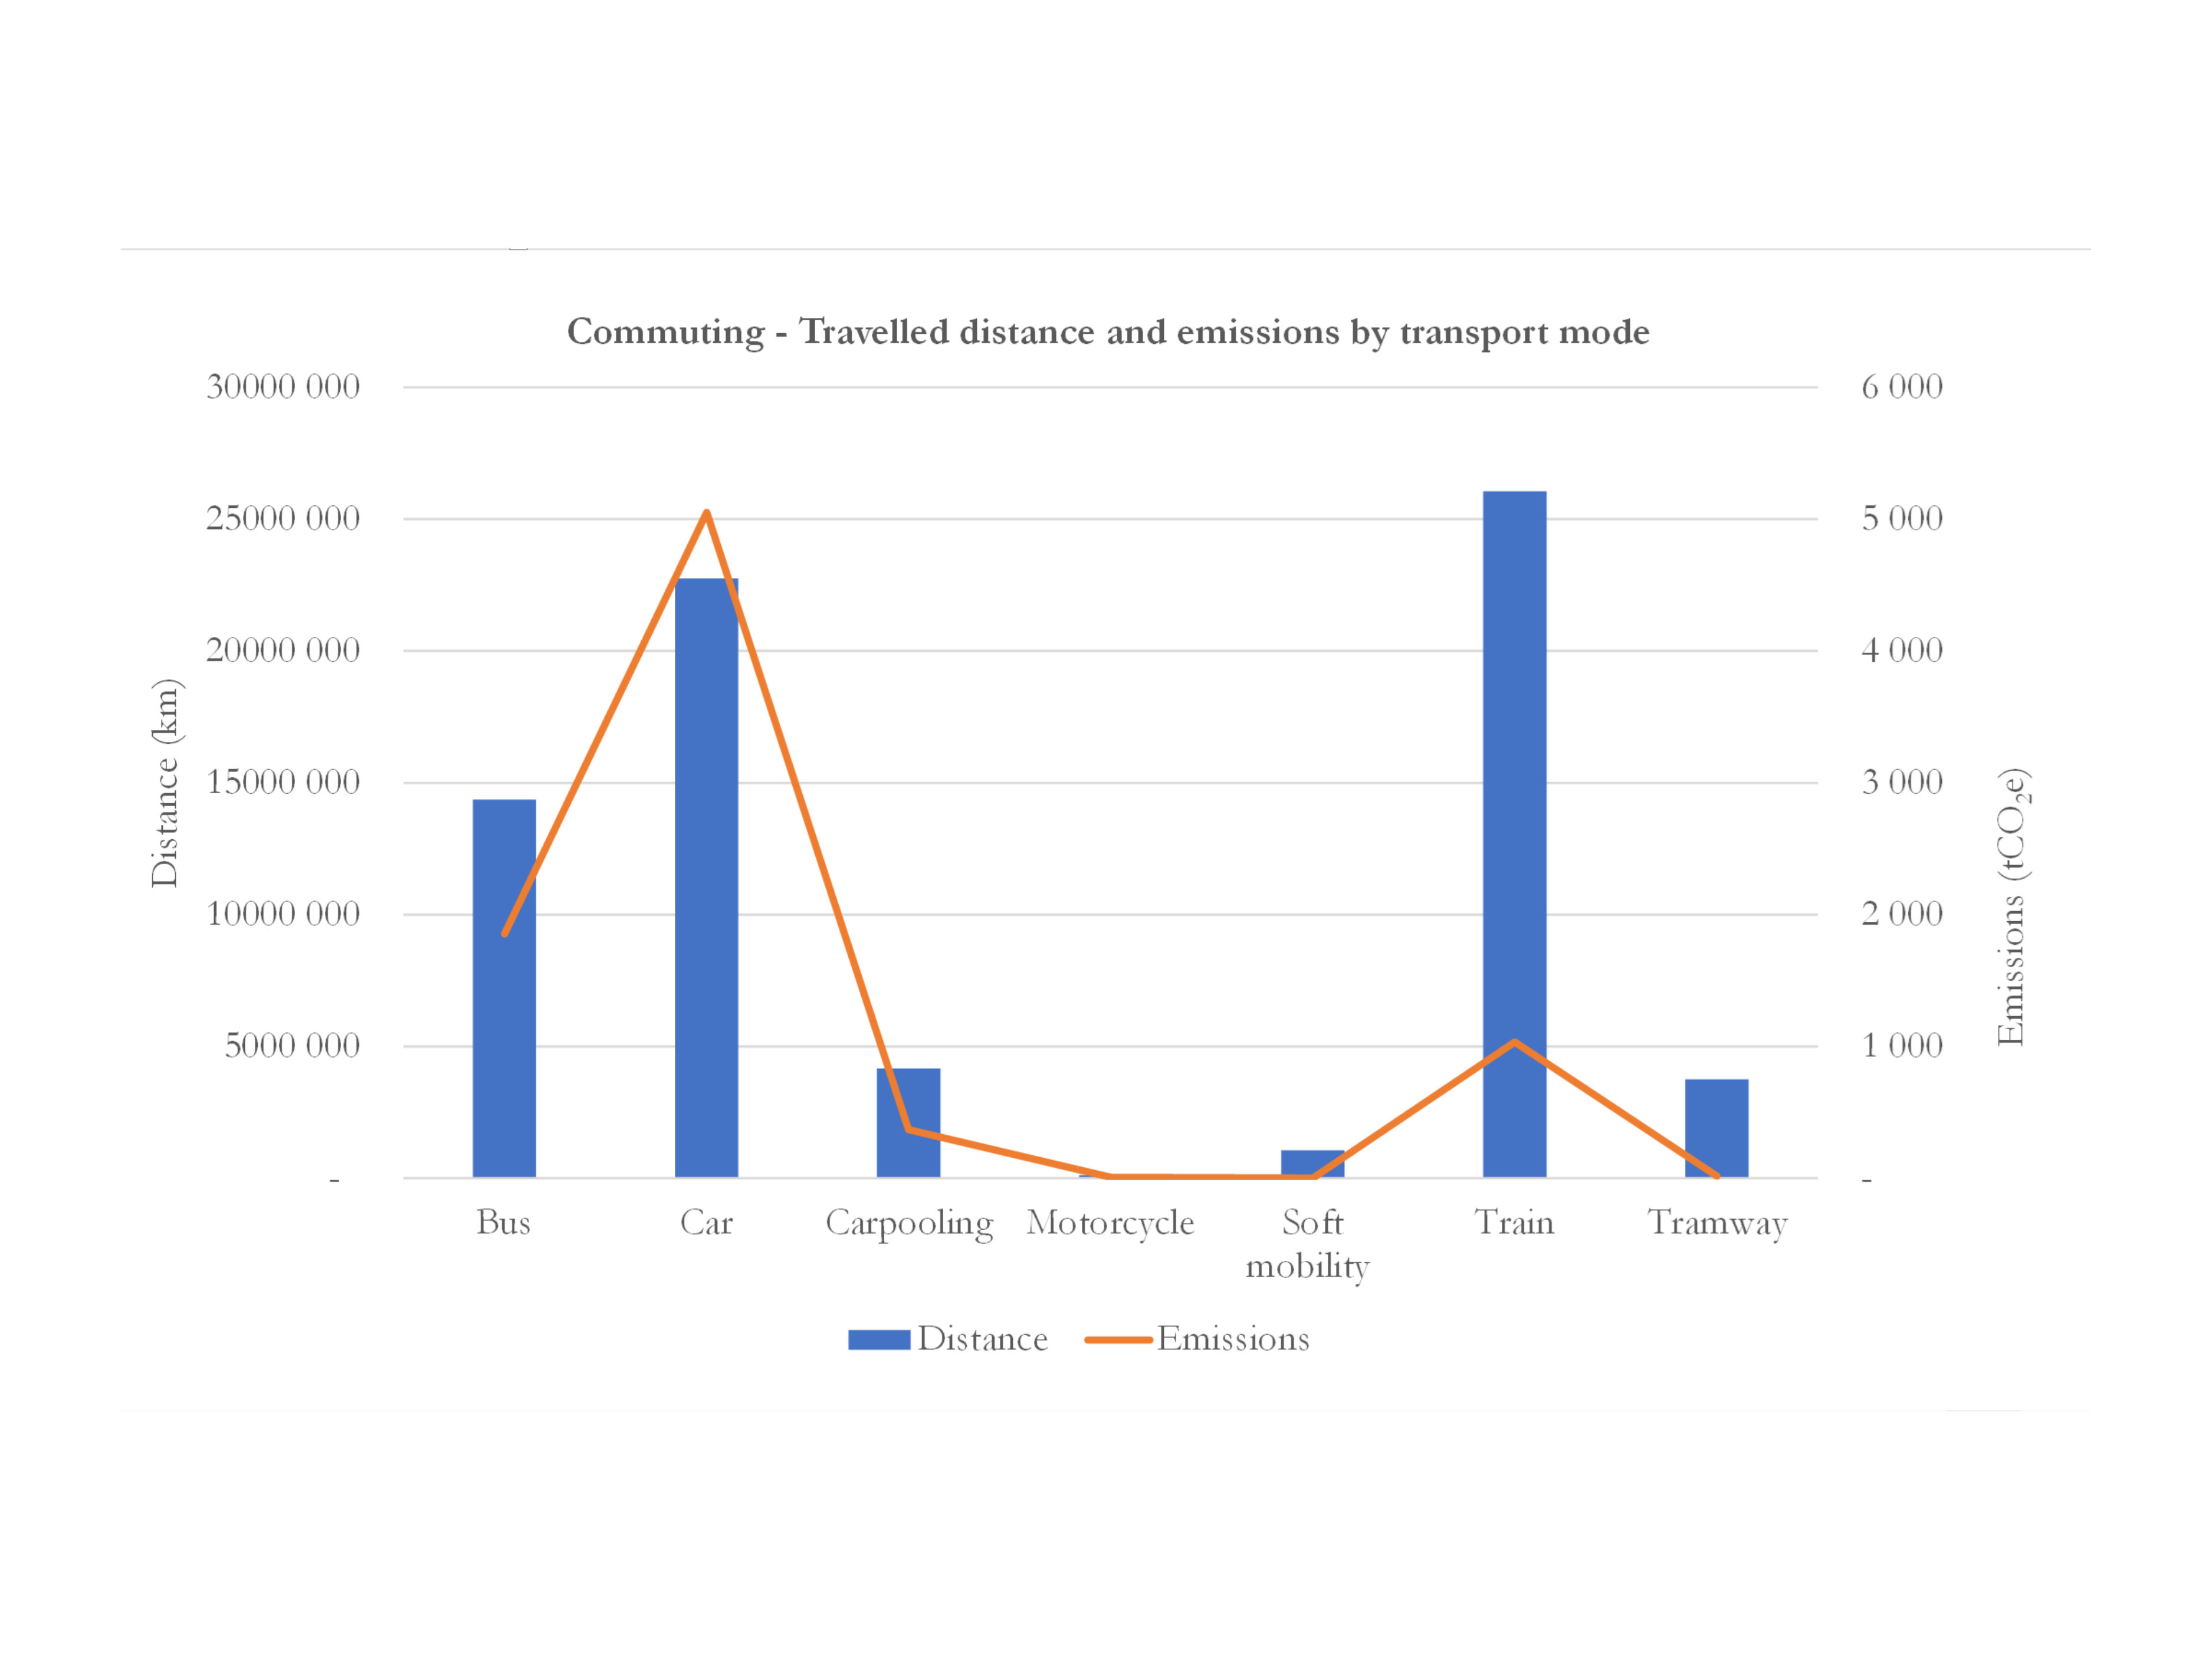
Figure 6: Commuting- Travelled distance & emissions by transport mode
The report also notes that the implementation of the University’s sustainable travel policy from 2025 could further reduce emissions linked to business travel.
In line with the continuous development of infrastructure, capital items emissions increased significantly.
Capital items accounted for 18% of total emissions in 2023 and increased by 13,4% compared to 2019.
This increase was mainly driven by the continuous growth of the University, requiring capital investments in :
- Scientific equipment,
- IT infrastructure, including:
- High Performance Computing (HPC)
- And new facilities such as the Disaster Recovery Site (DRS).
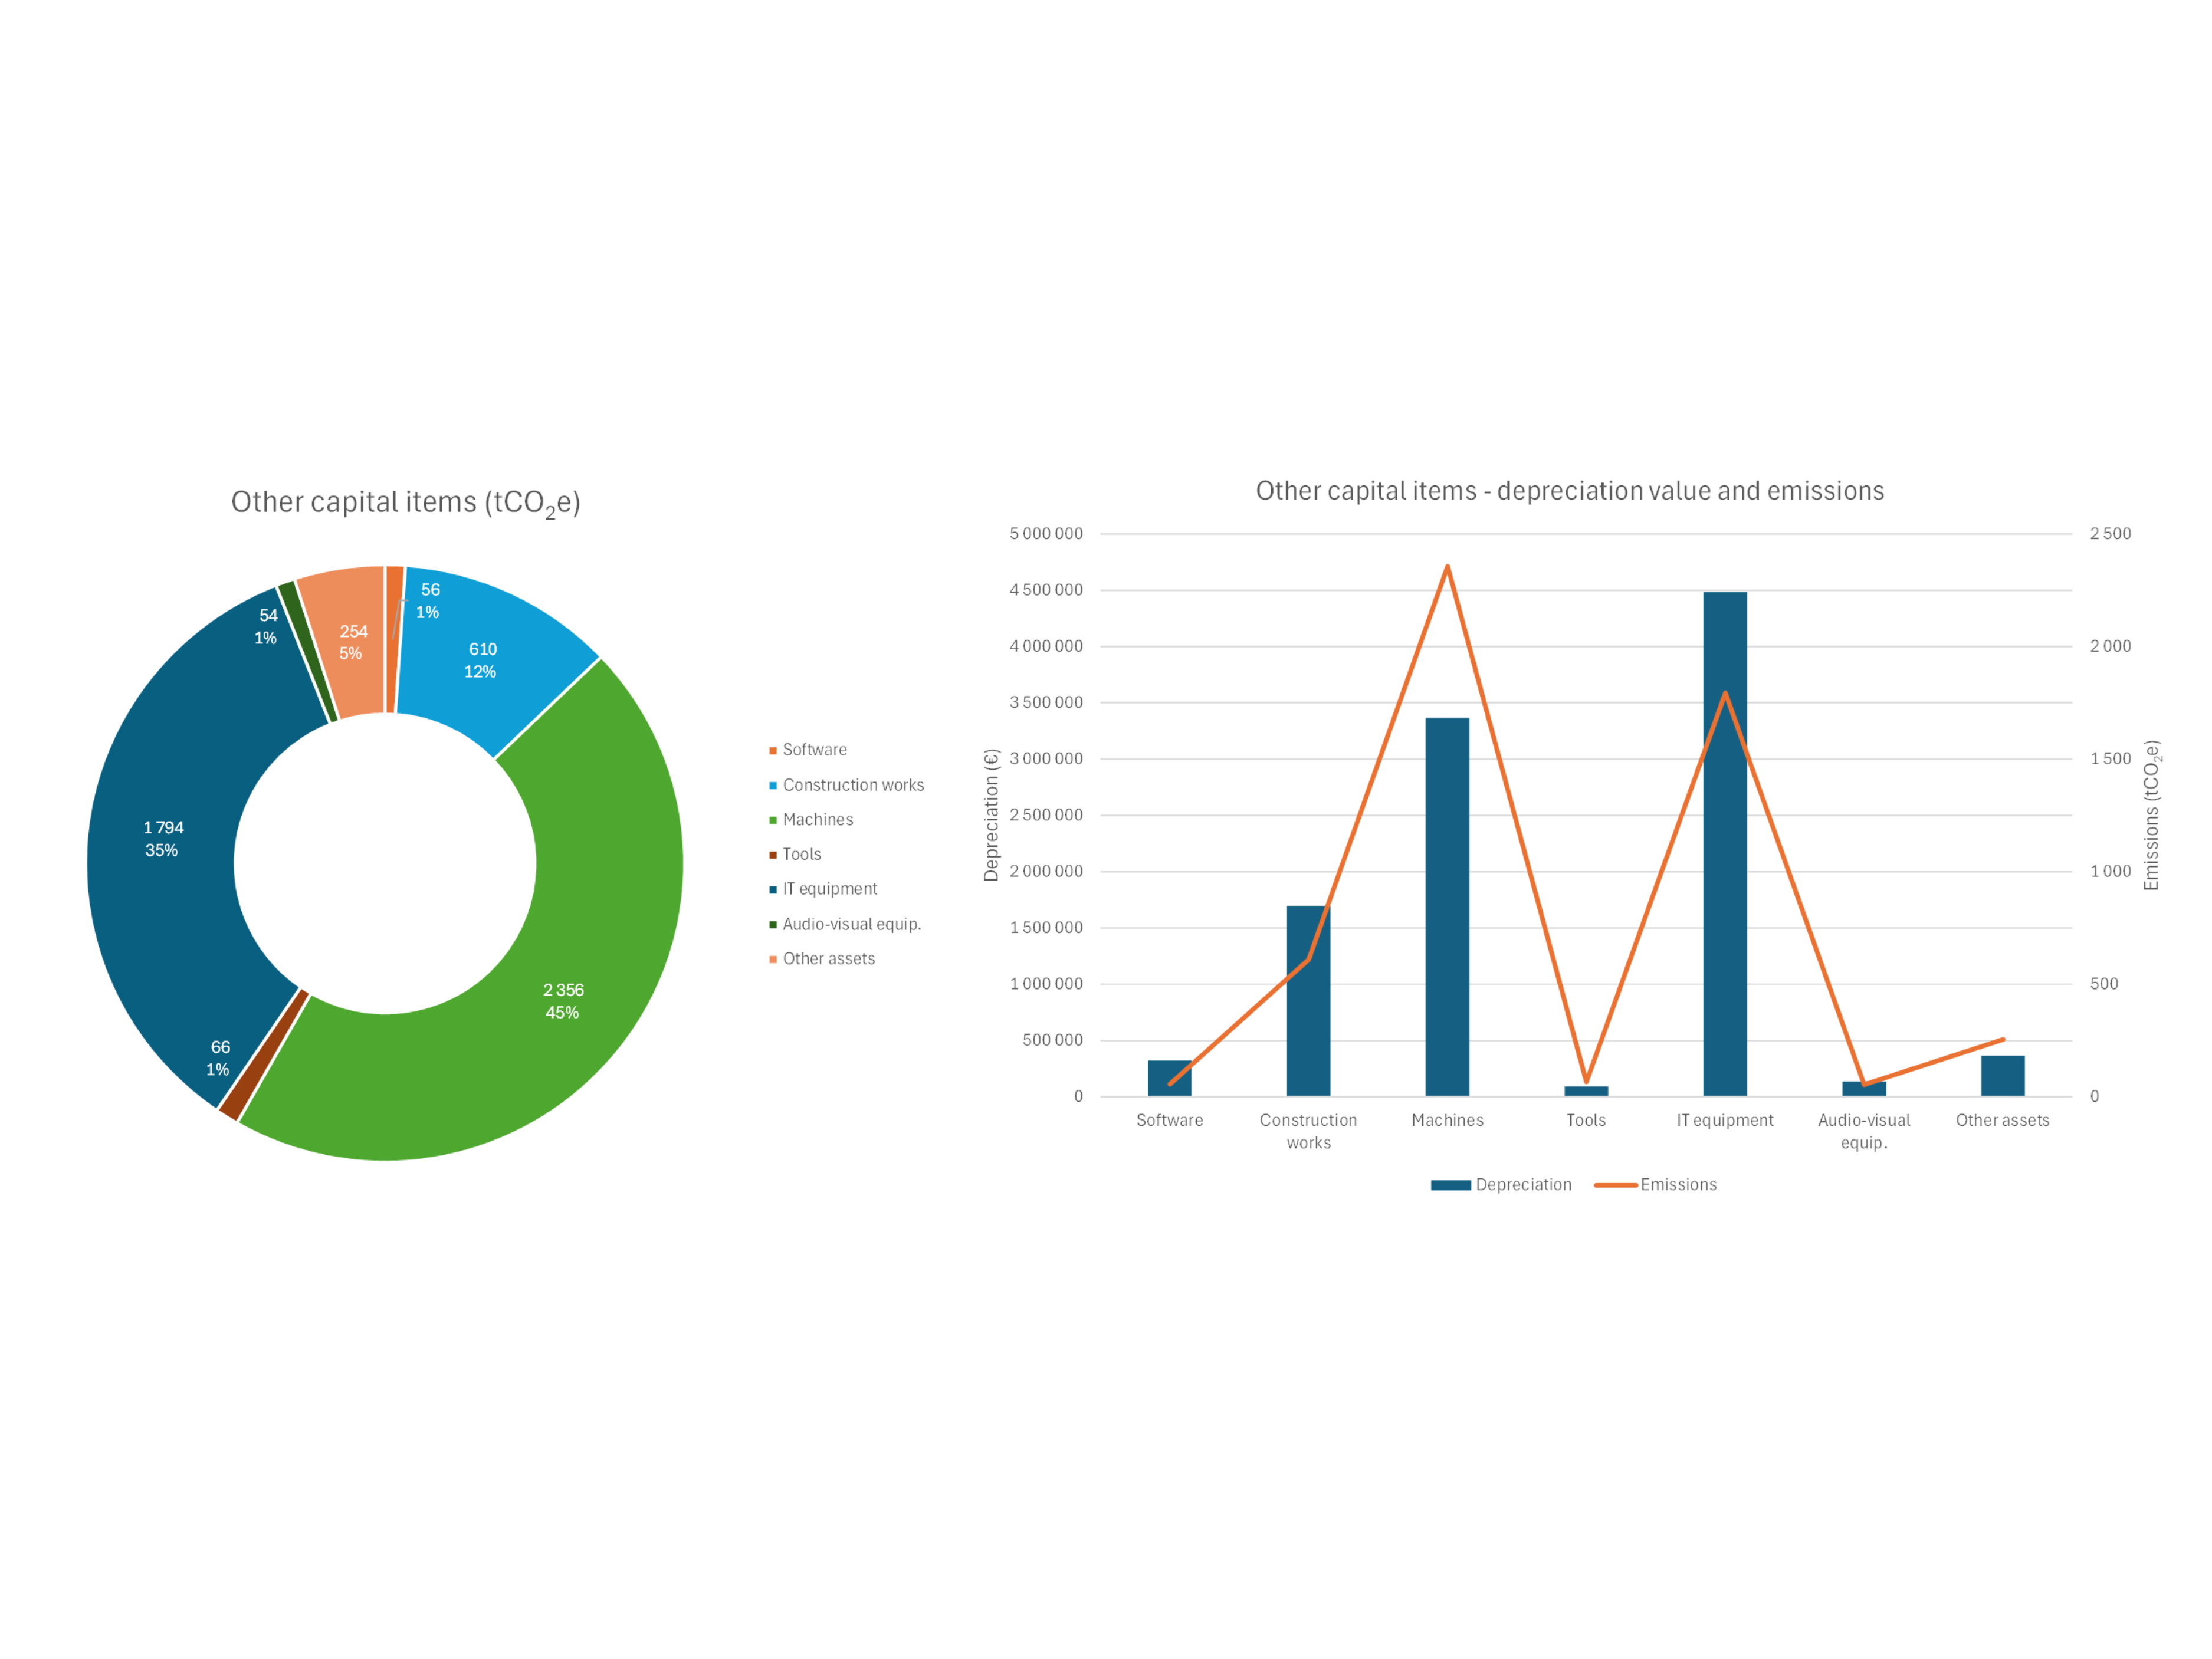
Figure 7: Other capital items; type of emissions in 2023 (left) – Emissions and depreciation values in 2023 (right)
The report identifies scientific and laboratory equipment and IT infrastructure as the largest contributors within this category, reflecting the University’s continued development in digitalisation and research infrastructure. The need for office and laboratory space remains strong and negatively affects the emissions related to buildings.
As a result of the University’s proactive approach to reducing energy consumption, energy-related emissions have seen the sharpest reduction.
Energy-related emissions represented 10% of total emissions in 2023 and decreased by 16,8% compared to 2019.
This reduction followed major energy-saving efforts implemented after the outbreak of the war in Ukraine and the destabilising impacts on the energy markets. These include adjustments in building management, reduction in temperature in the offices and lighting in common areas, optimisation of ventilation systems, and awareness campaigns encouraging energy-saving behaviours.
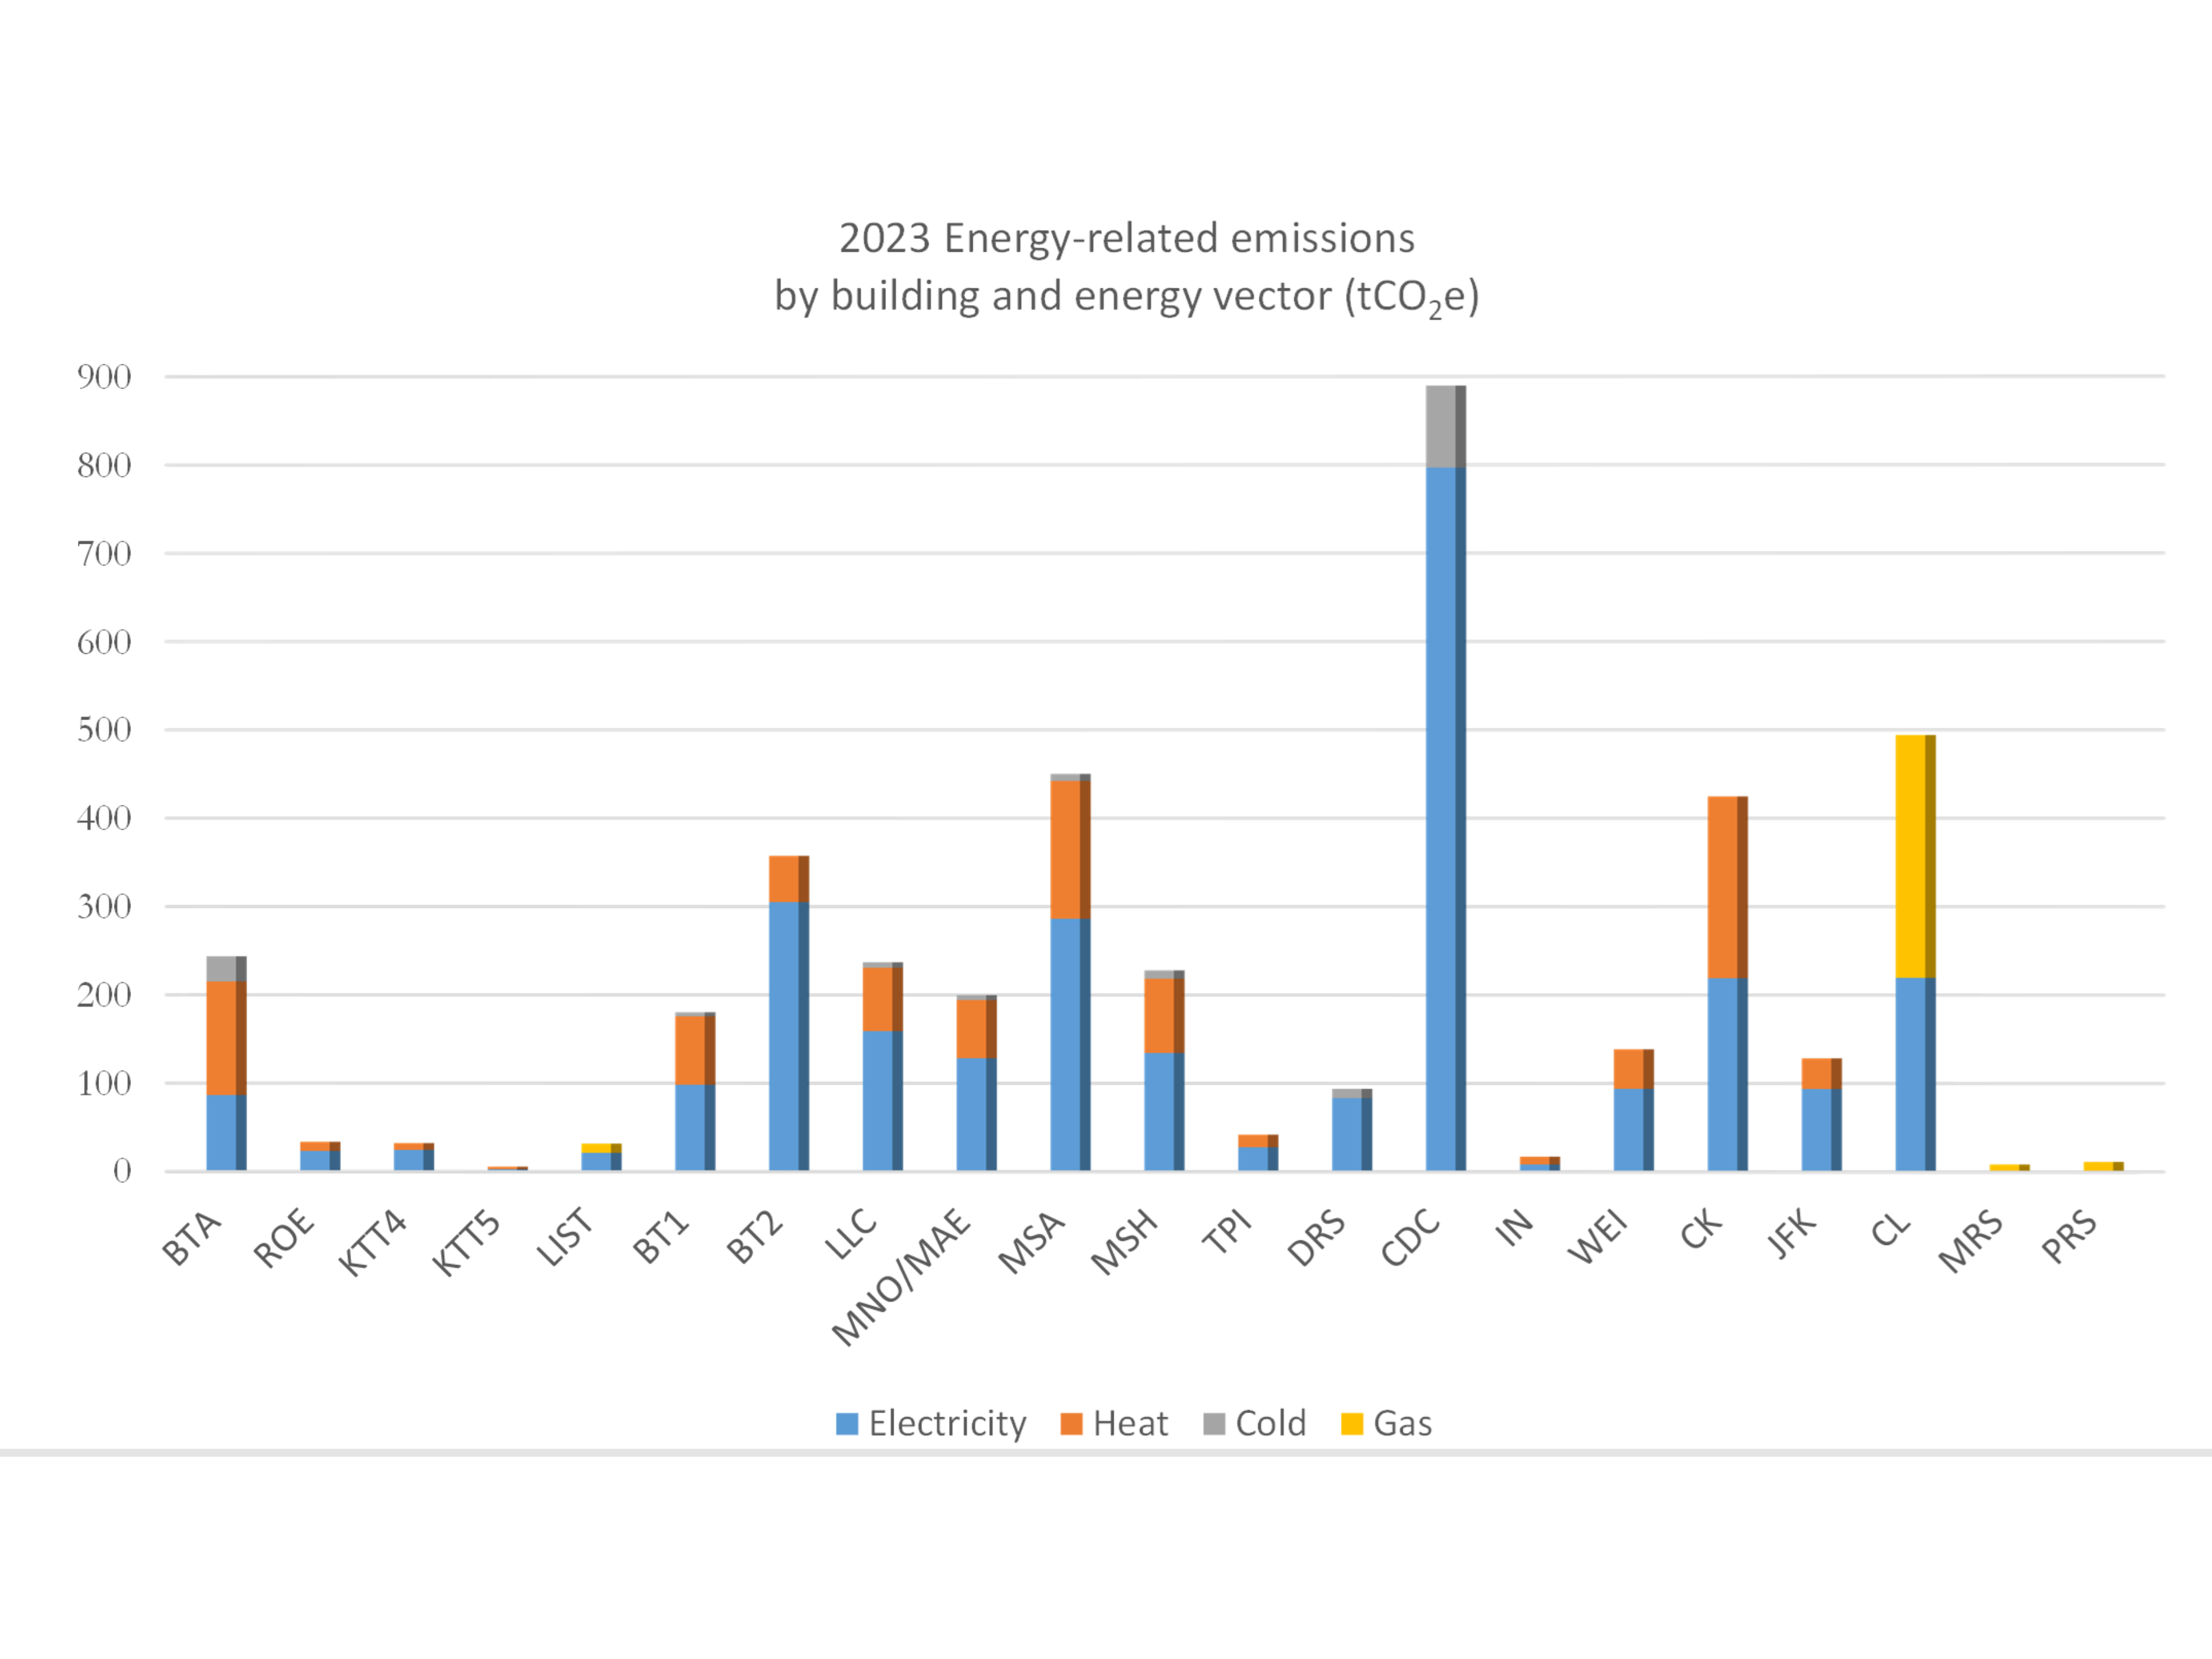
Figure 8: Emissions (energy) 2023 by building and energy vector
All the buildings recorded these massive decreases in energy consumption and related GHG emissions, with the notable exception of the Centre de Calcul (CDC), including HPC infrastructure and the Disaster Recovery Site (DRS), and the animal facility.
For more information on the present report, methodology, and calculations, please contact the Sustainability team at unilu.sustainability@uni.lu .
Download the full report here