
 Faculty of Science, Technology and Medicine
 Faculty of Law, Economics and Finance
 Faculty of Humanities, Education and Social Sciences
 Interdisciplinary Centre for Security, Reliability and Trust
 Luxembourg Centre for Systems Biomedicine
 Luxembourg Centre for Contemporary and Digital History
 Luxembourg Centre for European Law
 Luxembourg Centre for Socio-Environmental Systems
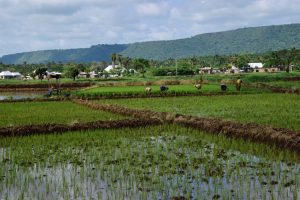
The need for data synthesis
Many of today’s defining scientific challenges — from feeding a growing global population, safeguarding biodiversity, combatting climate change, and achieving equitable development — clearly span disciplines. They involve ecological processes, economic structures, human health, governance systems, and social justice all at once.
To address such questions which somehow fall between the chairs, researchers need more than isolated studies: they need data-driven scientific synthesis that combines diverse datasets, standardizes measures across systems and quantifies relationships across scales.
This kind of synthesis transforms scattered information into integrated insights that bridge disciplinary boundaries and support decision-making for complex, real-world problems.
Let’s have a look at some examples.
Mapping global Land System Archetypes (LSA)
Simply out of curiosity Václavík et al. (2013)1 started to investigate, if there are global patterns identifiable in something that everybody would see as a very local and specific issue: Land use. Given the variety of geographic and environmental factors, one can be overwhelmed with the diversity of land use that we find in different regions. But that is not the end of the story. Given the access to markets, the labour force, subsidies, available technological and monetary resources as well as knowledge, people have diverse opportunities to shape landscapes. Thus, is it possible to identify patterns?
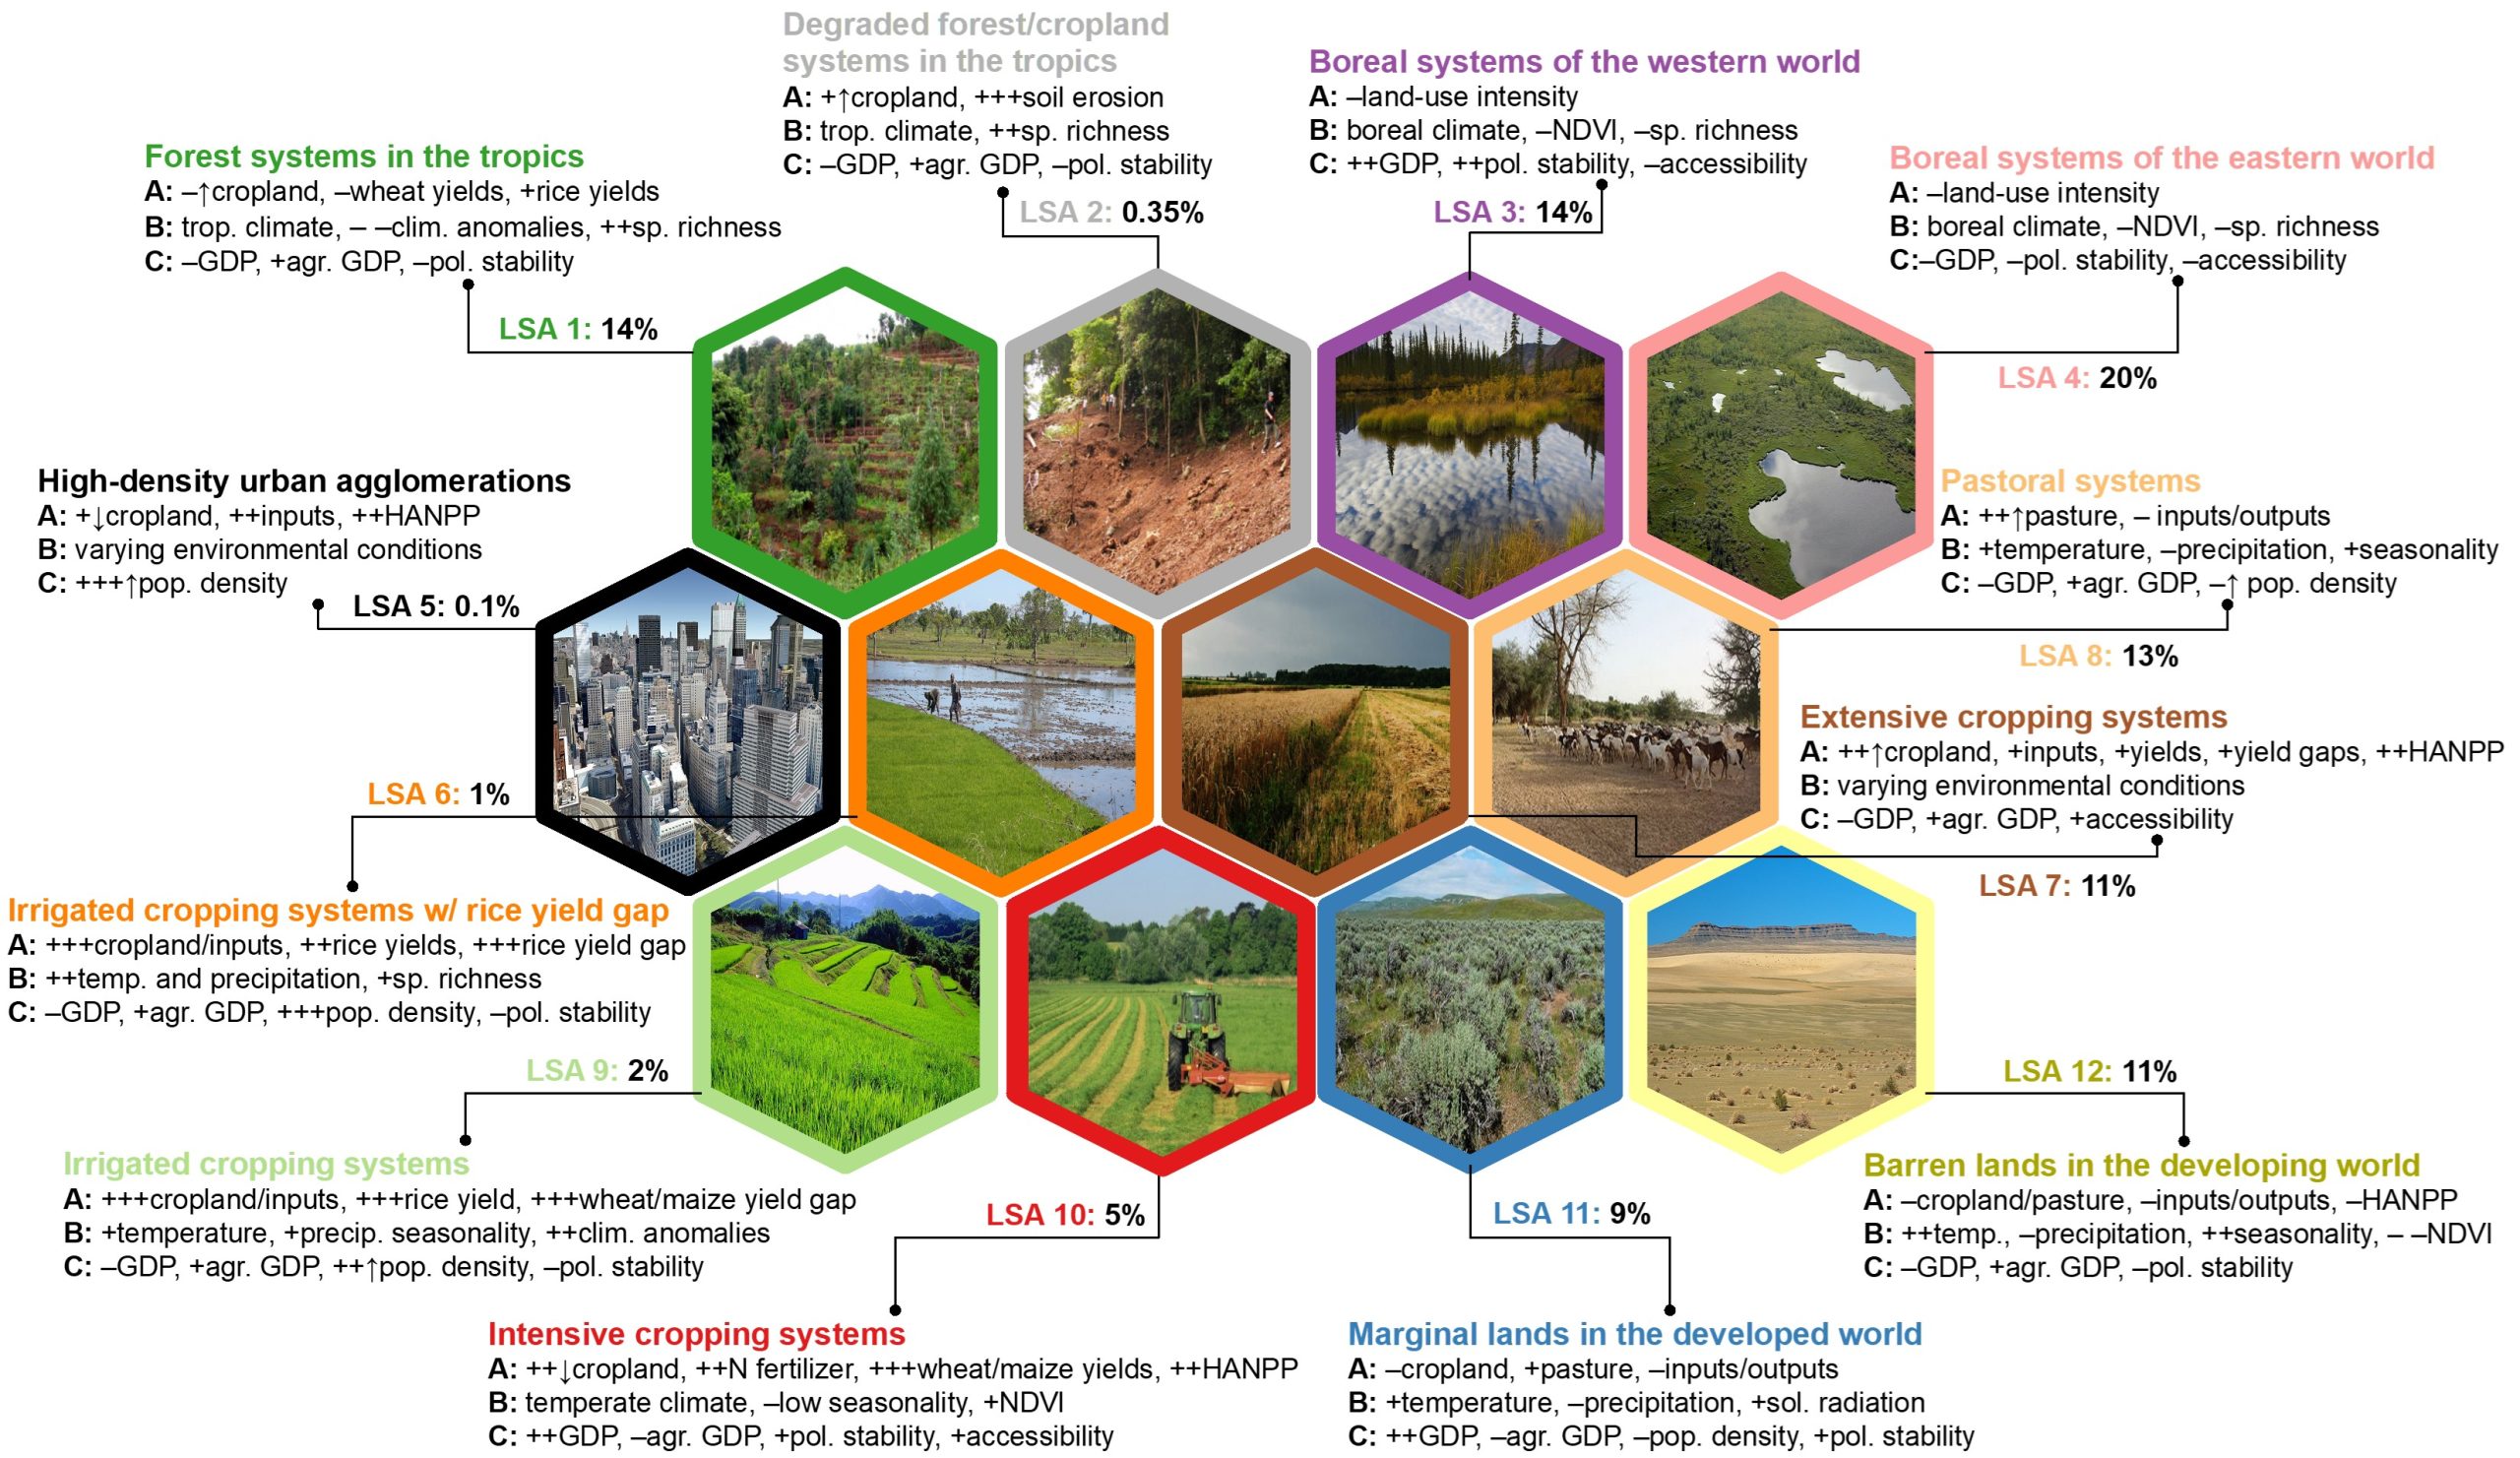
Overview of land system archetypes (LSA), summarizing major land-use intensity indicators (A), environmental conditions (B) and socioeconomic factors (C) that best characterize each archetype. The + and signs show whether the factor is above or below global average (+ is up to 1 s.d., ++ is 1–2 s.d., +++ is >2 s.d.); the ” and # signs signify increasing/decreasing trends within the last 50 years; the numbers represent percentages of terrestrial land coverage. The spatial position in this self-organizing map indicates similarity among land system indicators.
By combining 30+ global spatially explicit environmental, socio-economic variables, land system archetypes could be identified by applying clustering methods to these large datasets. Recurring combinations of land use and socioeconomic conditions reveal that land systems can be grouped into archetypes that reflect how human demand, environmental constraints and management practices interact. These archetypes appear in many places, showing that similar socio-ecological dynamics emerge globally, even across different cultural and environmental contexts. Because it integrates multiple disciplines — remote sensing, economics, ecology — this study provides a coherent framework that connects land-use patterns with global change processes.
This interdisciplinary approach illustrates the power of quantitative synthesis to openly link human and environmental systems beyond disciplinary silos.
Transformation archetypes in Global Food Systems
While the previous example applied a static view, aiming at the best spatial resolution Dornelles et al. (2022)2 used times series of global agricultural production to understand if there are similarities between trajectories of countries’ agricultural activities. The paper uses national statistics on agricultural production, environmental impact, nutrition and socio-economic indicators to identify distinct global pathways of food system development. By clustering countries based on multiple quantitative indicators, they identify “transformation archetypes” that characterize how different nations change over time:
- Countries follow different development pathways — some follow rapidly expanding production and environmental pressure, others prefer consolidating structures with slower change.
- Environmental impacts such as greenhouse gas emissions and ecological footprints often increase faster than productivity gains, even when social indicators improve.
- These archetypes reveal systemic patterns that single-discipline studies cannot detect, showing how intertwined economic, environmental and social processes shape outcomes globally.
This synthesis demonstrates that quantitative integration of diverse indicators can reveal patterns of transformation across whole systems, providing a basis for comparing policy outcomes internationally and crafting more sustainable trajectories.
Global variations in agrifood-system burdens
Levers and colleagues (2025)3 take an explicitly multi-dimensional synthesis approach by combining global subnational datasets that proxy four key burdens associated with agrifood systems: environmental footprint, climate change contribution, income poverty, and malnutrition. Instead of looking at one indicator or one country, this synthesis maps these burdens together to determine where they co-occur and how they relate to demographics, governance, and inequality. Levers et al. found that:
- Hotspots of multiple agrifood-system burdens occur widely, especially in low-income and (sub)tropical regions, affecting about 1.9 billion people and nearly 470 million hectares of agricultural land.
- Single burdens (e.g., environmental footprint alone) occur even more broadly, affecting about two-thirds of the global population and almost 40% of agricultural land.
- Regions inhabited by traditionally marginalised groups — including small-scale farmers and Indigenous peoples — are disproportionately exposed to multiple simultaneous burdens.
- Countries with higher economic inequality and weaker governance tend to exhibit more severe burden profiles.
- The study underscores that agrifood burdens vary not only between countries but also within them, pointing to the need for regionalised and context-specific policies rather than one-size-fits-all solutions.
By integrating environmental, social and governance data into a single mapping exercise, this work exemplifies how quantitative synthesis can reveal complex, spatially explicit patterns that single-discipline research cannot.
Why interdisciplinary scientific synthesis matters
These examples show how data-driven synthesis — by integrating data across disciplines and scales — enables science to:
- Reveal systemic patterns that are invisible to isolated case studies.
- Link human and environmental processes quantitatively to inform theory and policy.
- Identify co-occurring challenges that require bundled solutions rather than isolated interventions.
- Support evidence-based decision-making that reflects the complexity of real-world systems.
When researchers bridge disciplinary divides through synthesis, they not only summarise what is known — they expand what can be known by answering questions that cut across traditional knowledge boundaries.
1 Václavík T, Lautenbach S, Kuemmerle T, Seppelt R. (2019). Mapping global land system archetypes. Global Environmental Change. 2013(23):1637–47.
2 Dornelles AZ, Boonstra WJ, Delabre I, Denney JM, Nunes RJ, Jentsch A, et al. (2022). Transformation archetypes in global food systems. Sustainability Science. 2022(17):1827–1840.
3 Levers C, Mehrabi Z, Bajaj K, Ramankutty N, Siebert S, Seppelt R. (2025). Different places, different challenges: mapping global variations in agrifood-system burdens. Environ Res Lett. 20(12):124051.